


New figures released just two days before Election Day show significant growth among unaffiliated voters, a statewide Democratic registration advantage, and striking differences across congressional, county, and legislative districts.
NEW JERSEY — November 1, 2026 — New Jersey has reached 6,746,886 registered voters, an increase of 21,709 from October, according to the latest voter registration statistics released Sunday by the New Jersey Division of Elections.
The newly published figures provide a detailed picture of the state’s political registration landscape just two days before the November 3 general election.
Political data analyst Michael Matthews highlighted the findings Sunday evening, presenting registration changes across political parties, all 12 congressional districts, New Jersey’s 21 counties, and its 40 legislative districts.
His analysis reveals a state with a substantial Democratic registration advantage overall, geographically concentrated Republican strength, and a large population of voters who remain unaffiliated with either major political party.
However, the figures measure party registration, not votes cast or election results.
1. More Than 6.7 Million Registered Voters
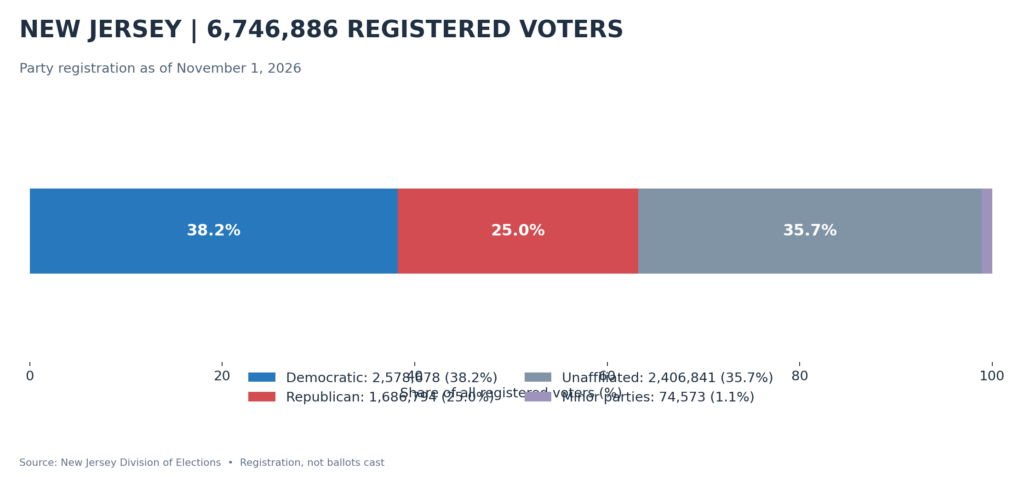
The November registration report provides the following statewide breakdown:
| Registration | Number of voters | Share |
|---|---|---|
| Democratic | 2,578,678 | 38.22% |
| Republican | 1,686,794 | 25.00% |
| Unaffiliated | 2,406,841 | 35.67% |
| Minor parties combined | 74,573 | 1.11% |
| Total | 6,746,886 | 100% |
Democrats have approximately 891,884 more registered voters than Republicans statewide.
The Democratic advantage represents about 13.22 percentage points of the total registered electorate.
Yet one of the most important findings is the size of New Jersey’s unaffiliated population.
More than 2.4 million residents, approximately 35.7% of all registered voters, are not formally affiliated with any political party.
That number is larger than the total Republican registration and only about 171,800 below the Democratic total.
The figures illustrate why party registration alone cannot fully describe New Jersey’s electorate.
2. Unaffiliated Voters Account for Most of the Monthly Increase
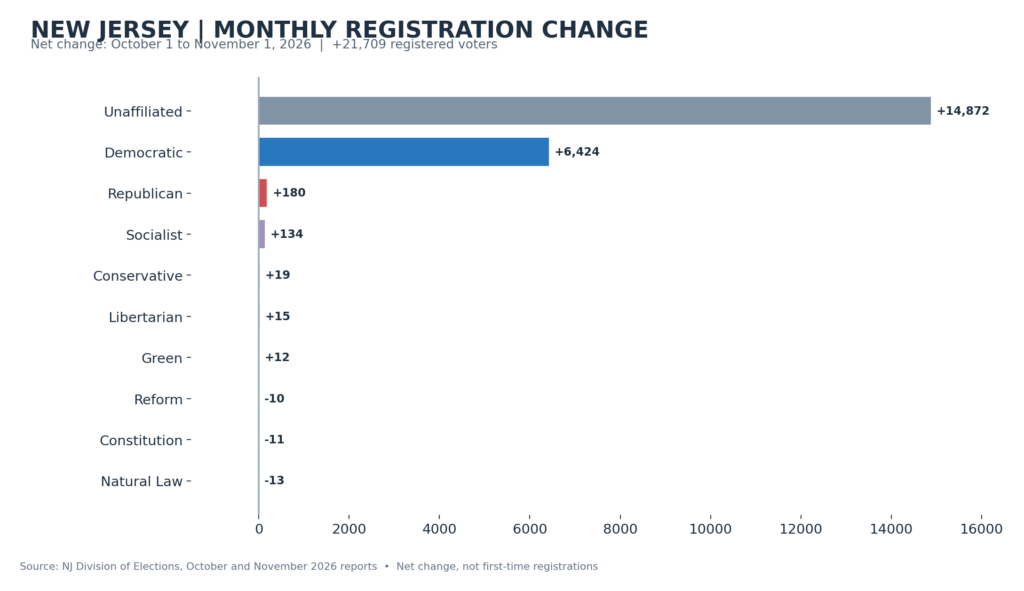
Between October 1 and November 1, the statewide voter registration total increased by 21,709.
Matthews’ breakdown of the changes corresponds with the official state figures:
| Party registration | Monthly change |
|---|---|
| Unaffiliated | +14,872 |
| Democratic | +6,424 |
| Republican | +180 |
| Socialist | +134 |
| Conservative | +19 |
| Libertarian | +15 |
| Green | +12 |
| Reform | −10 |
| Constitution | −11 |
| Natural Law | −13 |
Unaffiliated registration accounted for approximately 68.5% of the entire net statewide increase.
Democratic registration accounted for about 29.6% of the increase, while the net Republican gain was comparatively small.
The remaining changes were distributed among minor political parties.
These are net changes between monthly registration snapshots. They should not be interpreted as the number of first-time voters or as direct evidence that individuals changed their party affiliations.
The figures may reflect new registrations, party affiliation changes, administrative updates, removals, and other adjustments to voter rolls.
3. Congressional Districts: Nine Democratic Registration Advantages, Three Republican
New Jersey’s 12 congressional districts show sharp differences in party registration.
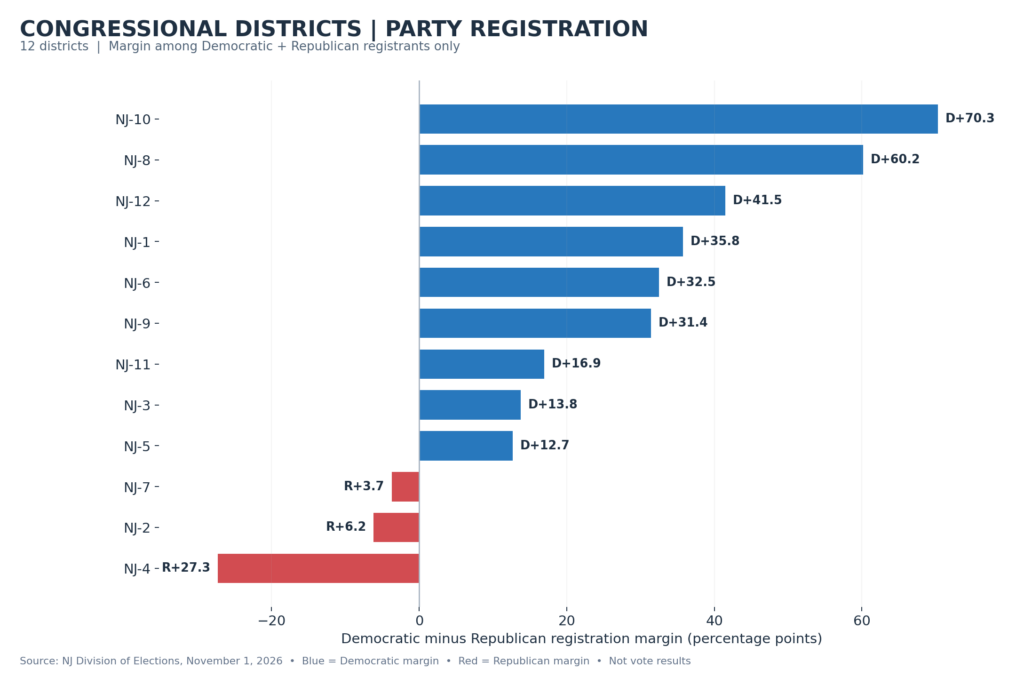
According to Matthews’ analysis, nine congressional districts have more registered Democrats than Republicans, while three have larger Republican registration totals.
The congressional figures below measure the percentage-point difference between Democrats and Republicans among voters registered with either of the two major parties, rather than among all registered voters.
| Congressional district | Registration margin |
|---|---|
| NJ-10 | D+70.3 |
| NJ-08 | D+60.2 |
| NJ-12 | D+41.5 |
| NJ-01 | D+35.8 |
| NJ-06 | D+32.5 |
| NJ-09 | D+31.4 |
| NJ-11 | D+16.9 |
| NJ-03 | D+13.8 |
| NJ-05 | D+12.7 |
| NJ-07 | R+3.7 |
| NJ-02 | R+6.2 |
| NJ-04 | R+27.3 |
D indicates a Democratic registration advantage; R indicates a Republican registration advantage.
The 10th Congressional District has the largest Democratic advantage under this measure, followed by the 8th and 12th districts.
The 4th Congressional District has the largest Republican registration advantage.
The 7th District is particularly notable because the difference between registered Republicans and Democrats is considerably smaller than in most other districts.
It has 218,231 registered Republicans and 202,524 registered Democrats, a difference of 15,707.
The 5th Congressional District also warrants attention. Democrats outnumber Republicans there by 46,941, but the district has more than 215,000 unaffiliated voters.
The presence of unaffiliated voters is important in interpreting these figures, because party registration does not establish candidate preferences.
4. County Analysis: Thirteen Democratic Registration Advantages and Eight Republican
Matthews also examined political registration across all 21 counties.
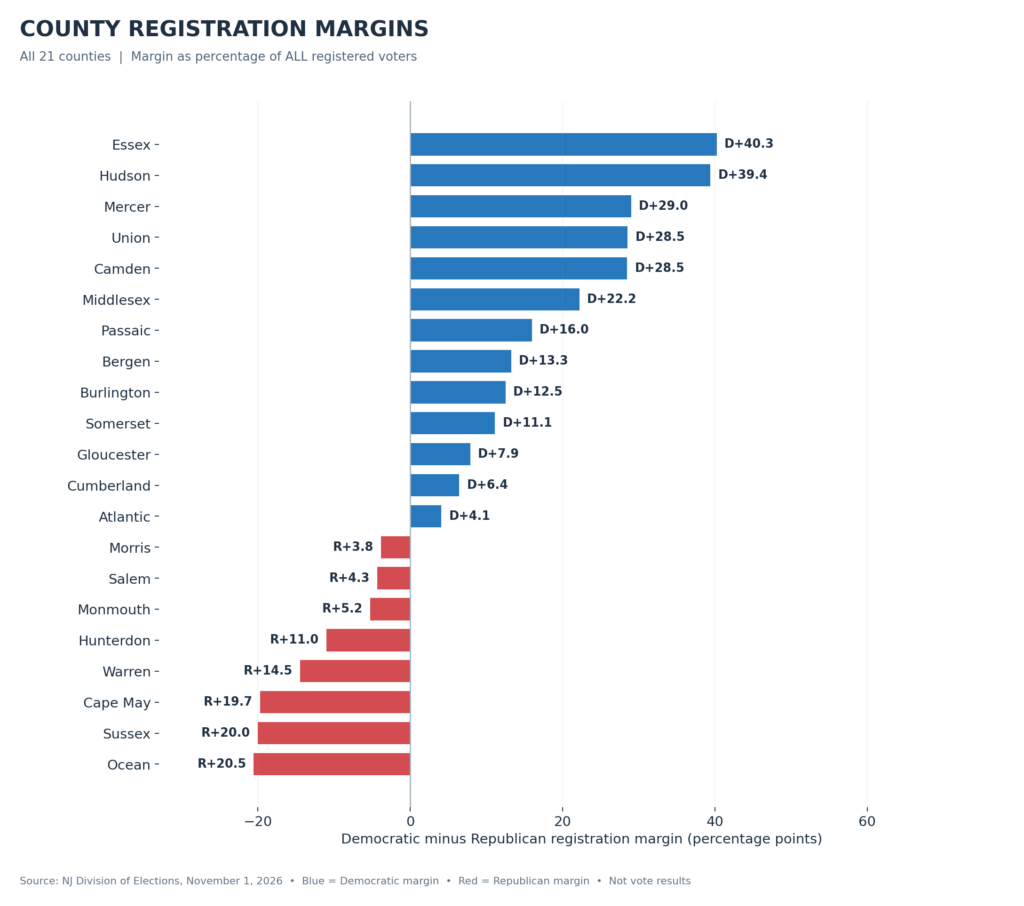
Unlike the congressional district figures, the following county margins represent the difference between Democratic and Republican registrations as a percentage of all registered voters in each county.
Counties with Democratic registration advantages
| County | Margin |
|---|---|
| Essex | D+40.3 |
| Hudson | D+39.4 |
| Mercer | D+29.0 |
| Union | D+28.5 |
| Camden | D+28.5 |
| Middlesex | D+22.2 |
| Passaic | D+16.0 |
| Bergen | D+13.3 |
| Burlington | D+12.5 |
| Somerset | D+11.1 |
| Gloucester | D+7.9 |
| Cumberland | D+6.4 |
| Atlantic | D+4.1 |
Essex and Hudson have the largest Democratic registration advantages under this calculation.
In Essex County, 298,874 voters are registered as Democrats, compared with 65,884 Republicans.
Hudson County has 228,320 registered Democrats and 55,327 registered Republicans.
Both counties also contain substantial numbers of unaffiliated voters.
Counties with Republican registration advantages
| County | Margin |
|---|---|
| Ocean | R+20.5 |
| Sussex | R+20.0 |
| Cape May | R+19.7 |
| Warren | R+14.5 |
| Hunterdon | R+11.0 |
| Monmouth | R+5.2 |
| Salem | R+4.3 |
| Morris | R+3.8 |
Ocean County has the largest Republican registration advantage as a share of all registered voters.
Its registration totals include 203,951 Republicans, 104,055 Democrats, and 172,875 unaffiliated voters.
Sussex and Cape May also show substantial Republican registration advantages.
Morris, Salem, and Monmouth have smaller margins, highlighting the variation within counties where Republicans outnumber Democrats.
The distribution demonstrates that New Jersey’s statewide registration advantage for Democrats is not uniform across its geography.
5. Bergen County: Unaffiliated Voters Outnumber Both Major Parties
Bergen County offers one of the most interesting examples of how party registration can differ from a simple two-party political comparison.
According to the November 1 state report, Bergen has 686,637 registered voters.
Of those:
- 260,937 are unaffiliated.
- 255,283 are registered Democrats.
- 164,181 are registered Republicans.
- 6,236 are affiliated with other political parties.
Democrats outnumber Republicans by 91,102, equivalent to approximately 13.3 percentage points of the county’s total electorate.
But the county’s largest individual registration category is unaffiliated voters.
This distinction is important for understanding local electoral participation in communities such as Fort Lee, Hackensack, Teaneck, Paramus, and Englewood.
Bergen’s registration data illustrates why differences between the two major parties do not tell the entire story.
The eventual election results will depend on actual participation and candidate selections, not simply the registration figures.
6. Legislative Districts: Political Registration Varies Dramatically
Matthews’ final analysis examined New Jersey’s 40 legislative districts.
The official data show that 29 have more registered Democrats than Republicans, while 11 have more registered Republicans than Democrats.
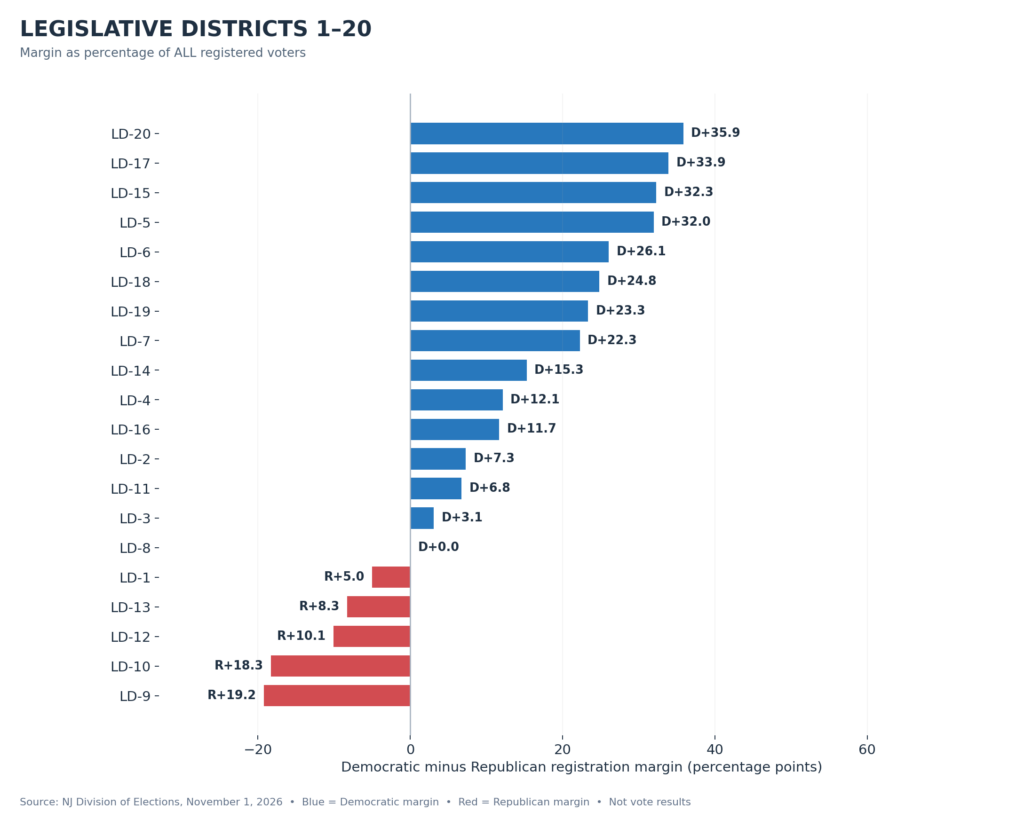
These margins are calculated using all registered voters in each district, including unaffiliated and minor-party voters.
Legislative Districts 1–20
| District | Registration margin |
|---|---|
| LD-01 | R+5.0 |
| LD-02 | D+7.3 |
| LD-03 | D+3.1 |
| LD-04 | D+12.1 |
| LD-05 | D+32.0 |
| LD-06 | D+26.1 |
| LD-07 | D+22.3 |
| LD-08 | D+0.02 |
| LD-09 | R+19.2 |
| LD-10 | R+18.3 |
| LD-11 | D+6.8 |
| LD-12 | R+10.1 |
| LD-13 | R+8.3 |
| LD-14 | D+15.3 |
| LD-15 | D+32.3 |
| LD-16 | D+11.7 |
| LD-17 | D+33.9 |
| LD-18 | D+24.8 |
| LD-19 | D+23.3 |
| LD-20 | D+35.9 |
Among the first 20 districts, LD-20 has the largest Democratic registration advantage, while LD-09 has the largest Republican advantage.
Legislative District 8 is particularly unusual.
Its registration figures show 60,191 Democrats and 60,162 Republicans — a difference of just 29 registered voters across a district containing 187,679 voters.
That translates to a Democratic advantage of approximately 0.02 percentage points of the full registered electorate.
Legislative Districts 21–40
| District | Registration margin |
|---|---|
| LD-21 | D+5.5 |
| LD-22 | D+29.9 |
| LD-23 | R+7.7 |
| LD-24 | R+16.7 |
| LD-25 | R+1.1 |
| LD-26 | R+6.3 |
| LD-27 | D+33.2 |
| LD-28 | D+56.2 |
| LD-29 | D+42.4 |
| LD-30 | R+22.4 |
| LD-31 | D+37.4 |
| LD-32 | D+39.5 |
| LD-33 | D+41.5 |
| LD-34 | D+39.7 |
| LD-35 | D+31.2 |
| LD-36 | D+17.5 |
| LD-37 | D+32.4 |
| LD-38 | D+12.8 |
| LD-39 | D+0.07 |
| LD-40 | R+0.02 |
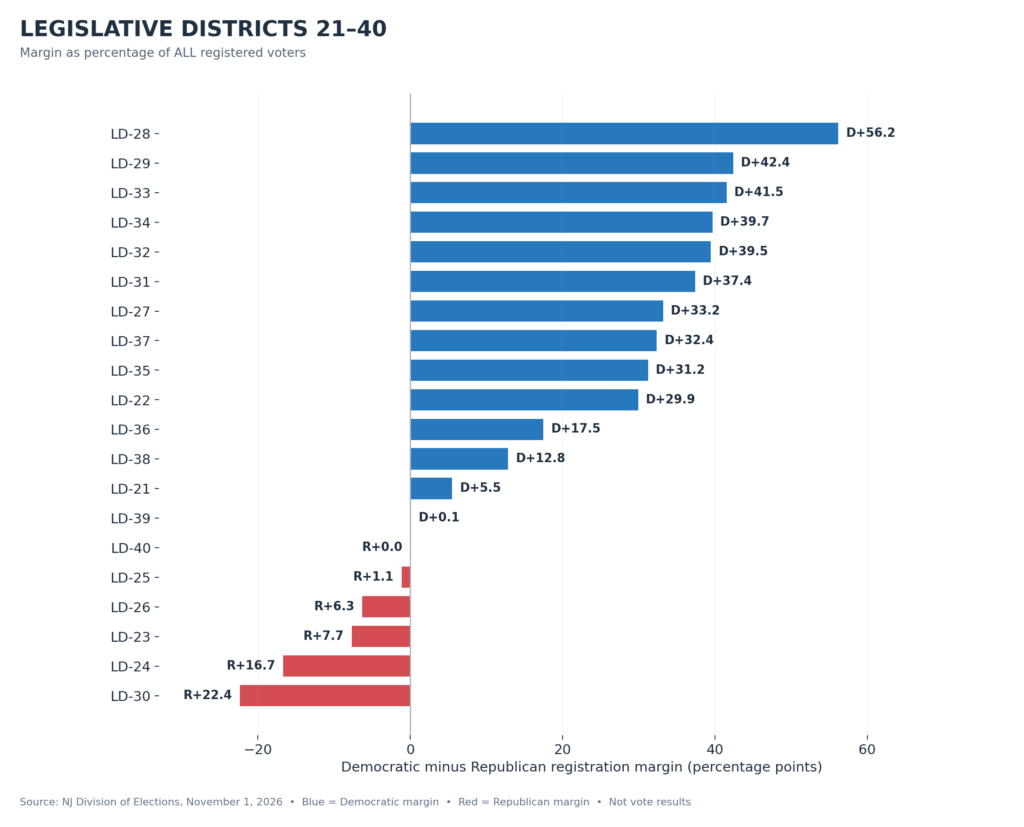
Legislative District 28 has the largest Democratic advantage among all 40 districts.
It has 89,424 registered Democrats and just 6,782 Republicans, resulting in a registration margin of approximately 56.2 percentage points when measured against all registered voters.
On the Republican side, LD-30 records the largest advantage, at approximately 22.4 percentage points.
Two other districts are notable for their exceptionally small differences.
In Legislative District 39, registered Democrats number 57,024, compared with 56,893 Republicans, a difference of just 131 voters.
In Legislative District 40, Republicans outnumber Democrats by only 38 registered voters: 60,882 Republicans compared with 60,844 Democrats.
These numbers show how dramatically political registration can vary from district to district, even within the same state.
They also demonstrate why legislative district registration should be examined separately from county and congressional district data.
7. Understanding the Numbers: Registration Is Not an Election Result
One important methodological distinction deserves attention.
The congressional margins reported by Matthews use registered Democrats and Republicans as the denominator.
His county and legislative district margins instead use the total registered electorate, including unaffiliated and minor-party voters.
For example, the 10th Congressional District has 275,536 registered Democrats and 48,040 Republicans.
The difference is approximately 70.3 percentage points when calculated using only those two party registrations.
But it is approximately 44.5 percentage points when calculated as a share of all registered voters in the district.
Both calculations describe the same underlying registration difference, but they answer different questions.
They should not be directly compared without explaining the denominator.
Most importantly, registration advantages do not translate automatically into election victories.
Unaffiliated voters may support candidates from either party. Registered party members may vote across party lines, abstain, or choose independent and third-party candidates.
Turnout rates can also vary across counties, districts, and political affiliations.
The figures therefore describe the composition of registered voters, not the outcome of the November 3 election.
8. What the November Registration Data Reveals About New Jersey
The newly released figures highlight several important characteristics of New Jersey’s electorate.
First, Democrats have a substantial statewide registration advantage, with nearly 2.58 million registered voters compared with approximately 1.69 million Republicans.
Second, unaffiliated voters remain a major component of the electorate and accounted for most of the net registration growth between October and November.
Third, the state’s political geography is highly uneven. Essex and Hudson have large Democratic registration advantages, while Ocean, Sussex, and Cape May show significant Republican advantages.
Fourth, the congressional and legislative district figures demonstrate that statewide totals cannot be used as a substitute for district-level analysis.
Finally, the narrow registration differences in legislative districts 8, 39, and 40 demonstrate how closely balanced the major-party registration totals can be in particular areas.
Taken together, the data provide a detailed portrait of New Jersey’s registered electorate at a politically important moment.
Conclusion: Millions Registered, Election Results Still Ahead
With 6,746,886 registered voters and the November 3 election approaching, New Jersey enters the final stage of the election calendar with a substantial Democratic statewide registration advantage and a significant population of unaffiliated voters.
The latest figures help explain the state’s political geography, but they do not establish how voters will cast their ballots.
The distinction between registration and actual voting is particularly important when evaluating the political significance of the new data.
The November registration report tells New Jersey who is registered to vote. The election results will tell the state how voters actually decided.
Sources: New Jersey Division of Elections, November 1, 2026 Statewide Voter Registration Reports by County, Congressional District and Legislative District; October 1, 2026 Statewide Registration Report; Michael Matthews (@mcm1071989), X posts, November 1, 2026.
By NJ RADAR Team