


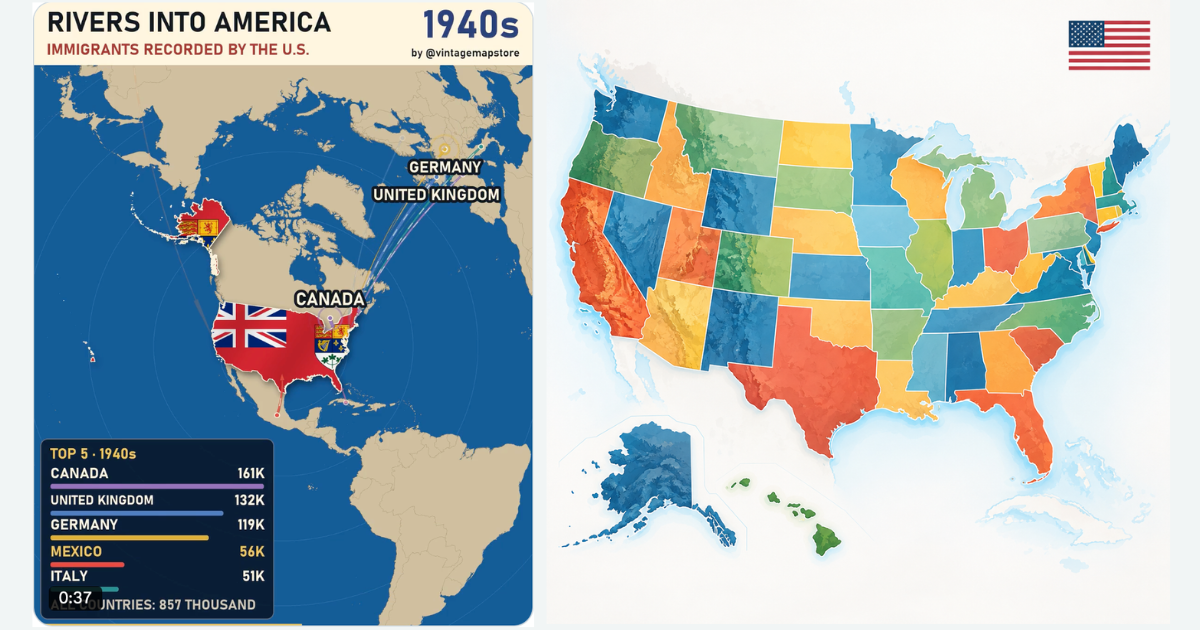
For more than two centuries, immigration has continuously reshaped the United States. The largest groups once came overwhelmingly from Europe — especially Ireland, Germany, Italy, and Eastern Europe — while later decades brought growing numbers from Latin America, Asia, Africa, and the Caribbean. This shift was driven not only by wars, famine, and economic opportunity, but also by major changes in U.S. immigration law. The result is a country whose immigrant population has changed dramatically over time, while immigration itself has remained one of the central forces shaping American society.
Watch the map long enough and America begins to look like what it has always been: a place shaped by movement.
An animated visualization titled “Rivers into America: 200 Years of Immigration to the U.S., Country by Country (1820–2023)” traces those movements across two centuries. Countries appear, streams grow wider or narrower, and the geographic center of immigration gradually shifts across the world.
Behind those moving lines are millions of individual journeys — people leaving famine, poverty, political upheaval and war, but also people seeking jobs, education, family and opportunity.
And the countries sending the largest numbers of immigrants to the United States have changed dramatically over time.
Ireland and Germany Shape the 19th Century
During the first half of the 1800s, many immigrants arriving in the United States came from the British Isles and Germany.
Then came one of the most recognizable immigration waves in American history.
The Irish potato famine beginning in 1845 devastated Ireland. According to the Library of Congress, about half a million Irish people arrived in America within five years of the famine, and an estimated 4.5 million Irish immigrants came to the United States between 1820 and 1930.
Between 1820 and 1860, the Irish accounted for more than one-third of all immigrants entering the country.
Germany was another major source of immigration. By the late 19th century, German-born residents formed one of the largest immigrant communities in America.
The numbers were significant enough to transform cities, neighborhoods, churches, schools, businesses and eventually American culture itself.
Then the Map Turns Toward Southern and Eastern Europe
Around the end of the 19th century and beginning of the 20th, the pattern changed again.
Increasing numbers of immigrants arrived from Italy, Russia, Austria-Hungary and other parts of Eastern and Southern Europe.
Italian immigration became particularly important. By 1960, Italians remained the largest single foreign-born origin group in the United States, accounting for about 13 percent of the immigrant population.
The great European migration helped create many of the communities that later became deeply associated with American cities — from Italian neighborhoods to Polish, Jewish, Greek, Hungarian and other immigrant communities.
In 1850, an extraordinary 92.2 percent of the foreign-born population in the United States had been born in Europe.
For decades, immigration to America was overwhelmingly a European story.
But it would not remain that way.
Immigration Slows
The United States began placing increasingly restrictive limits on immigration in the early 20th century.
National-origin quotas introduced during the 1920s sharply restricted immigration and heavily favored immigrants from Northern and Western Europe.
The effect can be seen in the numbers.
The foreign-born population represented 14.8 percent of the U.S. population in 1890. Beginning in the 1920s, that share steadily declined.
By 1970, only 4.7 percent of the U.S. population was foreign-born — the lowest share recorded in the modern Census series.
Then American immigration policy changed again.
1965 Changes the Direction of the Rivers
The Immigration and Nationality Act amendments of 1965 replaced the old national-origins quota system with a preference system emphasizing family reunification and certain employment skills.
The consequences became visible over the following decades.
The immigration map increasingly shifted away from Europe and toward Latin America and Asia.
Between 1960 and 1990, Latin America’s share of the foreign-born population increased dramatically. After 1980, people born in Latin America outnumbered European-born immigrants in the United States.
Asian immigration also expanded rapidly. The Asian share of America’s foreign-born population increased from 8.9 percent in 1970 to 19.3 percent in 1980.
Refugee resettlement following the Vietnam War contributed to the growth of Vietnamese and other Southeast Asian communities, while immigration from countries including China, India, Korea and the Philippines became increasingly important.
By 1990, the United States had more immigrants born in Asia than in Europe.
Mexico Becomes the Largest Country of Origin
Another major change was occurring closer to the United States.
Since 1980, Mexico has been the largest single country of origin among immigrants living in the United States.
For decades, Mexican immigration became one of the most visible features of the country’s changing demographics.
But even this story is changing.
The Mexican-born population remains by far the largest individual immigrant group, but its share of the overall immigrant population has declined from 29 percent in 2010 to about 22 percent in 2024.
Meanwhile, immigration from India and other parts of Asia has grown considerably, and migration from countries including Venezuela, Cuba, Guatemala, Colombia, Honduras, the Dominican Republic, Nigeria and Haiti has also increased.
America Today Looks Very Different From America in 1850
The contrast across two centuries is striking.
In 1850, the United States had about 2.2 million foreign-born residents, representing 9.7 percent of the population.
More than nine out of ten had been born in Europe.
By 2024, the foreign-born population had reached approximately 50.2 million people, or 14.8 percent of the U.S. population.
But their origins had completely changed.
Today, approximately 51.4 percent of America’s foreign-born population comes from Latin America and 30.8 percent from Asia.
Europe, which accounted for more than 92 percent in 1850, now represents only about 9.7 percent.
Africa accounts for a growing 5.9 percent.
Among individual countries, Mexico remains first, with about 11.1 million U.S. residents born there in 2024, followed by India with approximately 3.2 million and China with about 2.6 million.
Different Rivers, Same America
Look at the animation from beginning to end and one thing becomes obvious: there was never just one immigrant America.
The Irish arrived in huge numbers and became Americans. So did Germans.
Then Italians, Poles, Russians and people from across Eastern and Southern Europe arrived in numbers that once transformed the country’s demographics.
Later came larger streams from Mexico, the Caribbean, Central and South America, China, India, the Philippines, Vietnam and many other parts of Asia and the world.
The countries changed.
The routes changed.
The reasons for leaving home changed.
But generation after generation, the rivers kept flowing into the same place.
And over two centuries, those rivers became part of America itself.
Sources: U.S. Census Bureau; U.S. Citizenship and Immigration Services (USCIS); Library of Congress; Migration Policy Institute; Vintage Map Store (@vintagemapstore)
By NJ RADAR Team